Metrics appear on the y-axis in VCD 10.6

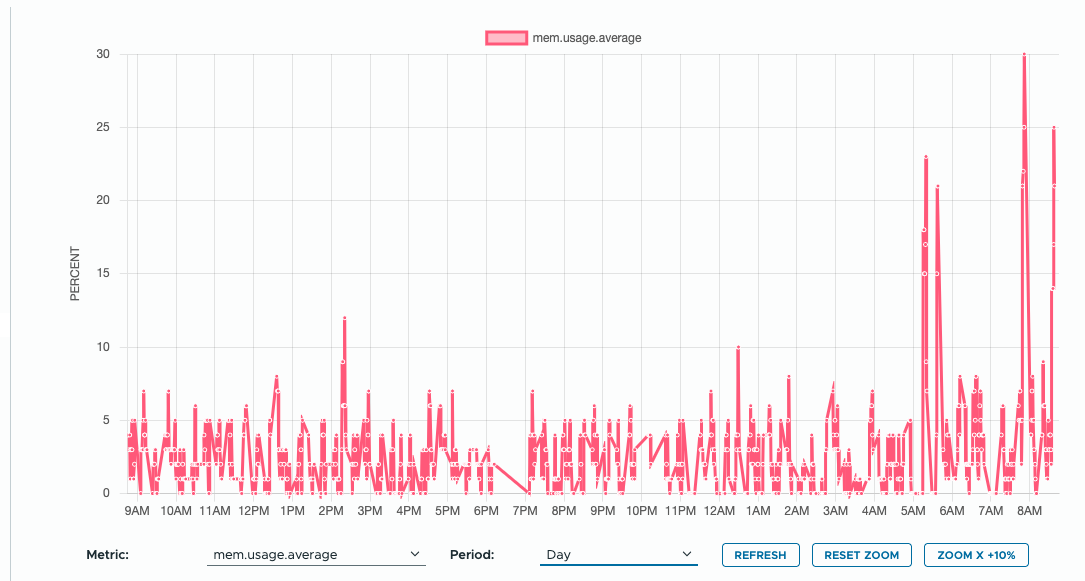
Virtual machine metrics charts in VMware Cloud Director 10.6.1 display all values along the y-axis. Certain data sets exceed the ability of the chart to display the data correctly. Issue caused due to a Bug in the code and this bug is fixed in the 10.6.1.1 release.

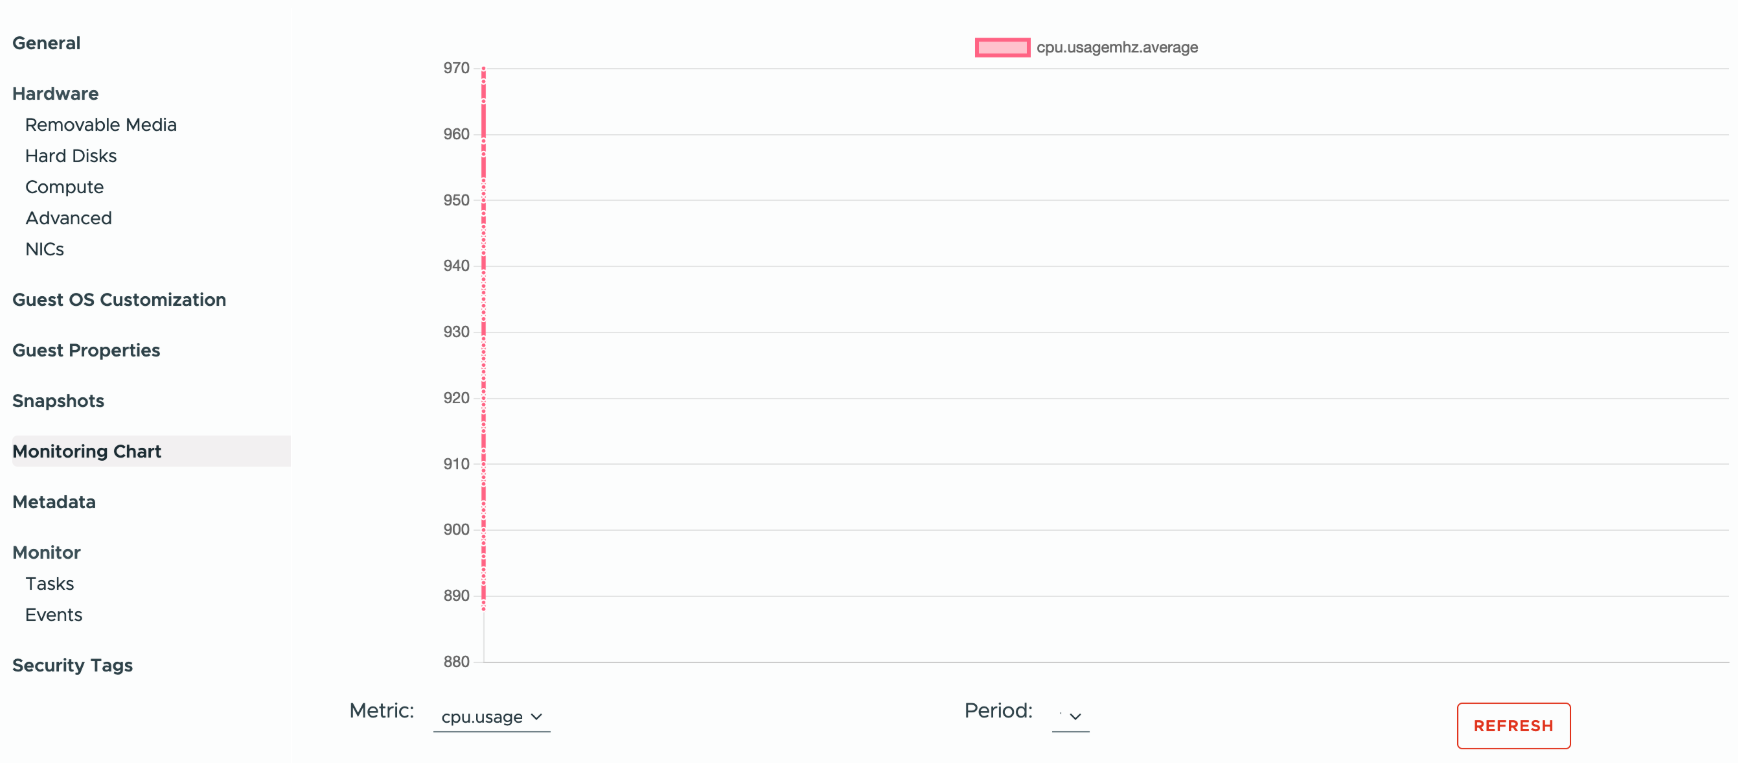
You need to upgrade VMware Cloud Director to version 10.6.1.1. After that, the metrics will be displayed correctly. Upgrade instruction is here :

https://techdocs.broadcom.com/us/en/vmware-cis/cloud-director/vmware-cloud-director/10-6/vmware-cloud-director-installation-and-upgrade-guide-10-6/deployment-uprade-and-administration-of-the-vcd-appliance-install/upgrading-and-migrating-your-vmware-cloud-director-appliance-install/upgrade-your-vcd-appliance-by-using-an-update-package-install.html

Leave a Reply

Your email address will not be published. Required fields are marked *

I’m Aigars

Welcome to Virtualisation Alley, my cozy corner of the internet dedicated to VMware. Here, I invite you to join me on a journey into virtual world. Let’s go.

Let’s connect