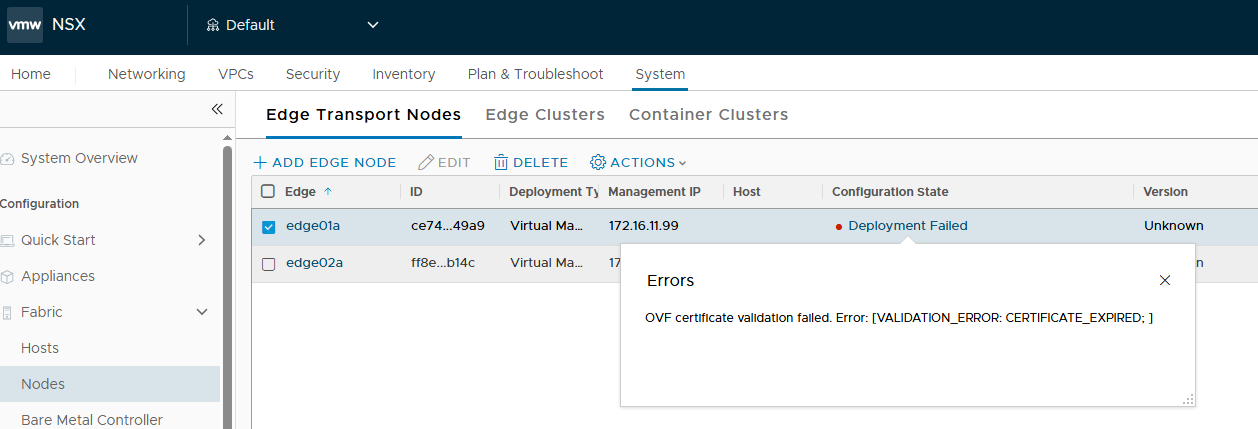
Packet Capture Edge Traffic on ESXi
First you need to find a ESXi server where Edge node is sitting. Example, search in vCenter for "duo-edge01"Find NIC Where Traffic Flows
Method A
Login to ESXi shell and use command ESXTOP → N to find NIC for Edge node.
Method B
Login to ESXi shell and use commands:
- esxcli network vm list –> (Copy the world ID and place it in port number section below)
- esxcli network vm port list -w <port number>
“Port ID:” and “Team Uplink:” will give the respective switchport and uplink.
[root@esx-05:~] esxcli network vm list | grep -i VM-2
  286924  VM-2          1

[root@esx-05:~] esxcli network vm port list -w 286924
   Port ID: 67108880
   vSwitch: RegionA01-VDS7
   Portgroup:
   DVPort ID: c14db2a2-c202-4c1c-bf8f-a702589a834a
   MAC Address: 00:50:56:9d:0c:73
   IP Address: 0.0.0.0
   Team Uplink: vmnic0
   Uplink Port ID: 2214592517
   Active Filters: vmware-sfw
Once the Switchport and vmnic is figured, use the below commands for captures.
Capture
pktcap-uw documentation is below:
UplinkRcvKernel — The function that receives packets from uplink dev at kernel side
UplinkSndKernel — Function to Tx packets on uplink at kernel side
VnicTx — Function in vnic backend to Tx packets from guest
VnicRx — Function in vnic backend to Rx packets to guest
https://kb.vmware.com/s/article/91506
#Capture all PING traffic

pktcap-uw --uplink vmnic0 --capture UplinkSndKernel,UplinkRcvKernel -o - | tcpdump-uw -enr - | grep "ICMP"

#Capture specific PING traffic

pktcap-uw --uplink vmnic0 --capture UplinkSndKernel,UplinkRcvKernel -o - | tcpdump-uw -enr - | grep "ICMP" | grep 87.246.173.54 | grep 195.122.12.206
When traffic is passing correctly you should see both request and response – ICMP echo request and ICMP echo reply. Also GENEVE encapsulated traffic.
[root@esx-04:~] pktcap-uw --uplink vmnic0 --capture UplinkSndKernel,UplinkRcvKernel -o- | tcpdump-uw -r - -nne | grep -i 20.0.0.10
The name of the uplink is vmnic0.
The session capture point is UplinkSndKernel,UplinkRcvKernel.
pktcap: The output file is -.
pktcap: No server port specifed, select 27896 as the port.
pktcap: Local CID 2.
pktcap: Listen on port 27896.
pktcap: Main thread: 419002739520.
pktcap: Dump Thread: 419003275008.
reading from file -, link-type EN10MB (Ethernet)
pktcap: Recv Thread: 419003803392.
pktcap: Accept...
pktcap: Vsock connection from port 1029 cid 2.
05:28:17.947409 00:50:56:60:17:49 > 00:50:56:61:25:c6, ethertype 802.1Q (0x8100), length 160: vlan 141, p 0, ethertype IPv4, 192.168.141.11.61837 > 192.168.141.13.6081: Geneve, Flags [C], vni 0x11800, proto TEB (0x6558), options [8 bytes]: 02:50:56:56:44:52 > 00:50:56:9d:0c:73, ethertype IPv4 (0x0800), length 98: 10.0.0.10 > 20.0.0.10: ICMP echo request, id 32771, seq 1026, length 64
05:28:17.947716 00:50:56:61:25:c6 > 00:50:56:60:17:49, ethertype 802.1Q (0x8100), length 160: vlan 141, p 0, ethertype IPv4, 192.168.141.13.50998 > 192.168.141.11.6081: Geneve, Flags [C], vni 0x10802, proto TEB (0x6558), options [8 bytes]: 02:50:56:56:44:52 > 00:50:56:9d:04:b9, ethertype IPv4 (0x0800), length 98: 20.0.0.10 > 10.0.0.10: ICMP echo reply, id 32771, seq 1026, length 64
05:28:18.947600 00:50:56:60:17:49 > 00:50:56:61:25:c6, ethertype 802.1Q (0x8100), length 160: vlan 141, p 0, ethertype IPv4, 192.168.141.11.61837 >
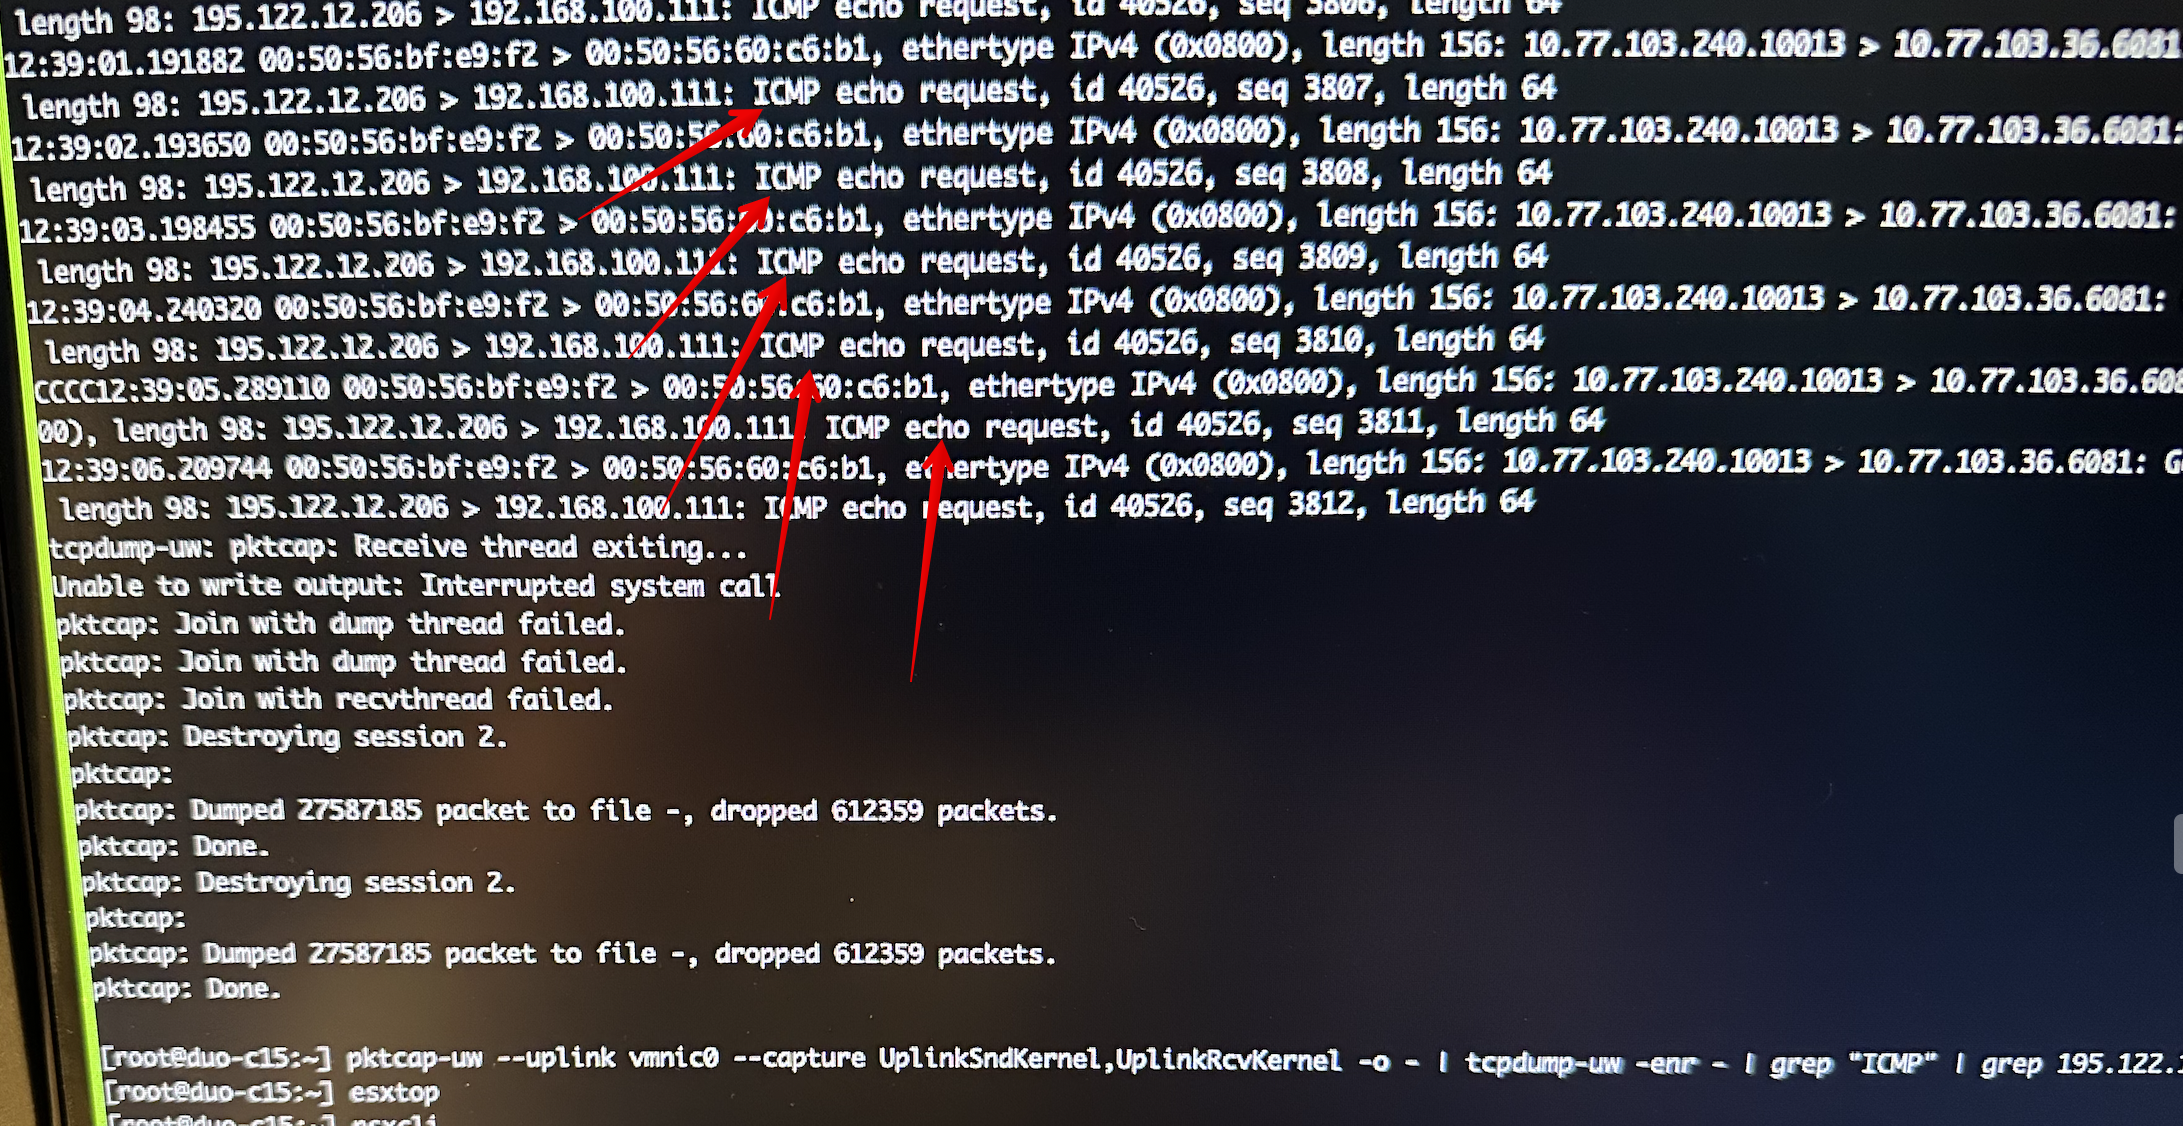
When something is wrong you will see only request – ICMP echo request.
Packet Capture VM Traffic
First you need to find a ESXi server where customer VM is sitting. Example, search in vCenter for “kerio-control-2”
Find NIC Where Traffic Flows
Method A
Login to ESXi shell and use commands:
- nsxcli
- get ports | find kerio-control-2
67112524 DvsPortset-0 kerio-control-2-aflB.eth3 4d6f9fcd-592-448-9780-54471c   00:50:56:01:04:2d vmnic1
67112525 DvsPortset-0 kerio-control-2-aflB.eth2 0c361b66-fc3f-463e-8d96-2c4ba2 00:50:56:01:06:4f vmnic1
67112526 DvsPortset-o kerio-control-2-aflB.eth1 a07a8e2-7af0-471e-86c3-f0527c  00:50:56:01:06:c1 vmnic0
67112527 DvsPortset-0 kerio-control-2-aflB.eth0 8c04afae-006-43f2-8f72-e4f047  00:50:56:01:18:8b vmnic0
Method B
Login to ESXi shell and use command ESXTOP → N to find NIC for VM.
Capture
pktcap-uw --switchport 67112527 --capture VnicTx,VnicRx -o - | tcpdump-uw -enr - | grep "ICMP" | grep 195.122.12.206
pktcap-uw --switchport 67112526 --capture VnicTx,VnicRx -o - | tcpdump-uw -enr - | grep "ICMP" | grep 195.122.12.206

pktcap-uw --uplink vmnic0 --capture UplinkSndKernel,UplinkRcvKernel -o - | tcpdump-uw -enr - | grep 195.122.12.206
pktcap-uw --uplink vmnic1 --capture UplinkSndKernel,UplinkRcvKernel -o - | tcpdump-uw -enr - | grep 195.122.12.206
Packet Capture on the Edge Uplink
- Login to the active Edge Node
- get into the vrf of SERVICE_ROUTER_TIER0
get logical-router <<<<< list of logical-router
vrf <vrf_number> <<<<< entering the respective vrf
get interface <<<<< list all the interfaces and look for “Port-type: uplink” “Interface” “IP” “MAC” to get the Edge uplink interface details
edge01(tier0_sr[6])> get interface

Fri Mar 17 2023 UTC 06:24:10.473

Logical Router

UUID                  VRF  LR-ID Name               Type

c4dce003-312e-4c29-8f2a-42326b223dee  6   17   SR-T0-Gateway-01         SERVICE_ROUTER_TIER0

Interfaces (IPv6 DAD Status A-DAD_Success, F-DAD_Duplicate, T-DAD_Tentative, U-DAD_Unavailable)

  Interface   : f65978d0-73ba-480b-b984-ec05e4b42a40 <<<<<<

  Ifuid     : 325

  Name     : EdgeUplinkB-TN1

  Fwd-mode   : IPV4_AND_IPV6

  Internal name : uplink-325

  Mode     : lif

  Port-type   : uplink <<<<<<<<

  IP/Mask    : 192.168.133.1/24 <<<<<<<<

  MAC      : 00:50:56:9d:9c:c5 <<<<<<<

  VLAN     : 133

  Access-VLAN  : untagged

  LS port    : e87abfd3-c2da-4e20-a106-2babd1d89cd6

  Urpf-mode   : STRICT_MODE

  DAD-mode   : LOOSE

  RA-mode    : SLAAC_DNS_TRHOUGH_RA(M=0, O=0)
Capture
Example, start capture interface <port-uuid-name> direction dual expression <expression>
edge01> start capture interface f65978d0-73ba-480b-b984-ec05e4b42a40 direction dual expression host 192.168.133.1

06:30:37.592896 00:50:56:9d:9c:c5 > 00:50:56:01:06:f8, ethertype IPv4 (0x0800), length 66: 192.168.133.1.56308 > 192.168.133.254.3784: BFDv1, Control, State Up, Flags: [none], length: 24

<base64>AFBWAQb4AFBWnZzFCABFwAA0AAAAAP8RLqjAqIUBwKiF/tv0DsgAIK3iIMADGCF4DxuO43LQAA9CQAAPQkAAAAAA</base64>


06:30:37.873333 00:50:56:01:06:f8 > 00:50:56:9d:9c:c5, ethertype IPv4 (0x0800), length 66: 192.168.133.254.49180 > 192.168.133.1.3784: BFDv1, Control, State Up, Flags: [none], length: 24

<base64>AFBWnZzFAFBWAQb4CABFwAA0IpBAAP8RzBfAqIX+wKiFAcAcDsgAIAZqIMADGI7jctAheA8bAA9CQAAPQkAAAMNQ</base64>